Nhận xét:
Bài này viết đủ từ cũng hơi khó
Cần đưa kết bài và thêm lời vào thì mới đủ từ được: Agriculture and fishing, More people earned jobs due to the fact that became less popular…
Chú ý các từ thầy paint colour

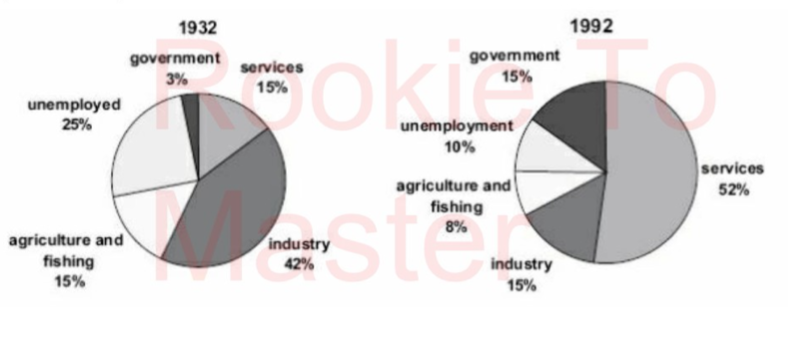
Two pie charts show how the workforce was distributed in Britain in the year 1932 and 1992.
Overall, the dominance of industry was replaced by the services. Besides, more people got jobs in 1992 than 1932.
In 1932, Industry accounted for 42% which was the highest proportion. Then it decreased dramatically to 15%. Next, Agriculture and fishing became less popular. It took up 15% in 1932, followed by a decrease of 8% in 1992. More people earned jobs due to the fact that the rate of unemployment went down from 25 % to 10%. In contrast, 1992 witnessed a considerable rise in service that rocketed to over a half in the total. Moreover, the percentage of People working in the government sector increased five-folds from 3% to 15%, making it the biggest increase among sectors of workforce.
In summary, there were a great deal of changes in workforce distribution between 1932 and 1992. The biggest changes belonged to Industry, Services, government
(158 words)