Tag Archives: task 1

Cụm từ task 1

Thayanhielts (dạy online, offline, hybrid) 0963082184
👌👌👌👌👌Cụm từ task 1👌👌👌👌👌

  1. The chart illustrates the distribution of household income across various age groups in the United States.
    (illustrates – mô tả, distribution – phân phối, various – các, age groups – nhóm tuổi, United States – Hoa Kỳ)
  2. Overall, younger age groups tend to have lower household incomes compared to older age groups.
    (Overall – tổng thể, younger – trẻ hơn, older – già hơn, tend to – có xu hướng, lower – thấp hơn, compared to – so với)
  3. Specifically, individuals aged 18-25 have the lowest median income, while those aged 45-54 have the highest.
    (Specifically – cụ thể, individuals – cá nhân, aged – tuổi, lowest – thấp nhất, median income – thu nhập trung bình, highest – cao nhất)
  4. Interestingly, the income disparity between age groups becomes more pronounced after the age of 35.
    (Interestingly – thú vị là, income disparity – sự chênh lệch thu nhập, becomes – trở nên, pronounced – rõ ràng, after – sau, age – tuổi)
  5. In contrast, the median income for individuals aged 65 and above is relatively stable, showing a slight decrease in the oldest age group.
    (In contrast – ngược lại, relatively – tương đối, stable – ổn định, showing – cho thấy, slight – nhỏ, decrease – giảm, oldest – lớn tuổi nhất)
  6. Looking at gender differences, male earners generally outpace their female counterparts across all age groups.
    (Looking at – nhìn vào, gender differences – sự khác biệt giới tính, male – nam, earners – người kiếm tiền, generally – nhìn chung, outpace – vượt qua, female – nữ, counterparts – đối tác)
  7. However, the income gap between men and women narrows among older age groups, suggesting some progress towards gender equality.
    (However – tuy nhiên, income gap – khoảng cách thu nhập, narrows – thu hẹp, among – giữa, suggesting – gợi ý, progress – tiến bộ, gender equality – bình đẳng giới)
  8. When comparing income levels by educational attainment, it becomes evident that individuals with higher levels of education tend to earn more.
    (When – khi, comparing – so sánh, income levels – mức thu nhập, educational attainment – trình độ giáo dục, becomes evident – trở nên rõ ràng, tend to – có xu hướng, earn – kiếm được)
  9. Those with graduate degrees consistently have the highest median income, followed by those with bachelor’s degrees, then those with high school diplomas or less.
    (Those – những người đó, graduate degrees – bằng cử nhân, consistently – một cách nhất quán, followed by – tiếp theo là, bachelor’s degrees – bằng cử nhân, high school diplomas – bằng cấp 3 hoặc thấp hơn)
  10. Overall, the data highlights the complex interplay between age, gender, and education in shaping household income levels.
    (Overall – tổng thể, data – dữ liệu, highlights – nhấn mạnh, complex – phức tạp, interplay – tương tác, shaping – hình thành)

Bài mẫu pie chart

The two pie charts illustrate the distribution of household expenses (sự phân bổ chi tiêu gia đình) in the United Kingdom in 1990 and 2010. The categories of expenditure include housing, transportation, food, and other expenses.

Overall, there were notable changes (sự thay đổi đáng kể) in the spending patterns of UK households over the two decades. Housing and food expenses saw a decrease (nhìn thấy một sự giảm) , while transportation costs increased significantly.

In 1990, the largest portion of household spending was on housing, accounting for 35% (chiếm 35%) of the total expenditures. However, by 2010, there was a considerable decline (sự giảm mạnh) in spending on housing, dropping to 25%.

The second most significant expense in both years was food, representing 25% of household spending (chiếm 25% chi tiêu gia đình) in 1990. Nevertheless, by 2010, there was a notable reduction in food expenses, which accounted for only 20% of the total.

In contrast, transportation expenses witnessed a remarkable increase (tăng rất mạnh) over the two decades. In 1990, only 15% of household spending was allocated (phân bổ) to transportation, whereas in 2010, this figure rose significantly to 30%.

Other expenses, including leisure, education, and healthcare, remained relatively stable (duy trì ở mức tương đối ổn định) at 25% in 1990 and experienced a marginal decrease (sự giảm nhẹ) to 25% in 2010.

To conclude, the distribution of household expenses in the United Kingdom underwent notable changes between 1990 and 2010, with a significant decrease in housing and food spending, and a substantial increase (sự tăng mạnh) in transportation costs.

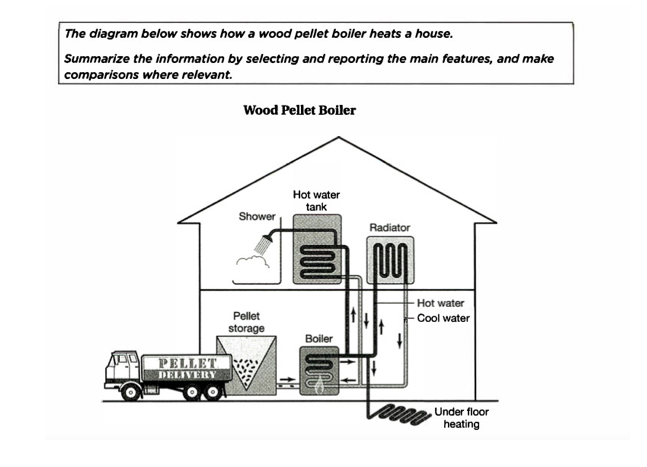
sample process of heating a house

The  diagram shows the process of heating a house by a wood pellet boiler system

Overall, The wood pellet boiler  system consists of four main components: pellet storage, boiler, hot water tank, and Radiator 

Firstly, wood pellets were delivered to the house that is equipped with wood pellet boiler system.  Wood pellets are kept in pellet storage house. Next, wood pellets go to a boiler that burns wood to generate hot water. From here, Hot water moves up to the hot water tank that is connected to the shower. If water in Hot water tank is cold, it moves down and goes to the boiler to be heated again. After that,  from the boiler, hot water also moves up to radiator that turns hot water into cool water before moving down and going to the boiler. This process repeats itself.  Finally, Hot water tank, radiator, and boiler together are connected, which provides heat for underfloor

(155 words by Thay Anh)

Sai lầm hay mắc khi viết biểu đồ tròn

Thầy Anh tổng hợp những sai lầm học viên của thầy hay mắc khi mới học viết biểu đồ tròn

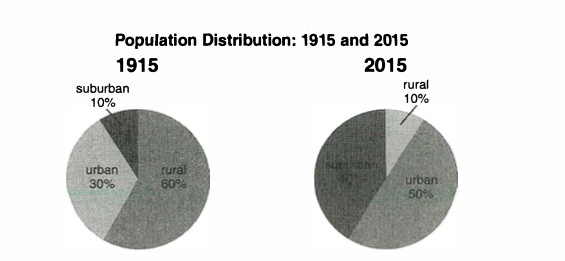
Đề bài thường có 2 biểu đồ tròn như hình trên

Một số sai lầm khi viết biểu đồ tròn

Sử dụng peak

Ví dụ: Urban reached a peak at 50% in 2015. Chú ý: peak hay dùng trong biểu đồ đường hơn nhé

Viết lại: Urban accounted for 30% in 1915 while it increased sharply to 50% for last century

So sánh 2 mục khác nhau ở 2 biểu đồ khác nhau

Ví dụ. in 1915 Rural made up 60% which was higher than urban 50%

Giải thích: Chỉ so sánh mục cùng loại để thấy sự tăng giảm

Viết lại: in 1915 Rural made up 60%, and then it decreased dramatically to 10% in 2015

Sử dụng chênh lệch phần trăm không hợp lý

in 1915, Rural was 30% higher than Urban.

Giải thích: Vì Rural gấp đôi Urban nên viết như trên chưa hợp lý

Viết lại: The percentage of people living in rural was twice than that of of urban.

Cấu trúc as…as trong bài task 1

As…as ngoài việc sử dụng trong so sánh bằng mà nhiều bạn đã biết, nay thầy hướng dẫn những cách sử dụng mới của cấu trúc as…as nhé

As much (danh từ không đếm được) as

In 2020, Company A produced as much amount of rice as Company B

Trường hợp nói gấp 2,3 ta chỉ cần thêm twice hoặc three times trước as nhé.

Ví dụ. The amount of gas sold in 2020 was twice as much as in 2019

As many (danh từ đếm được) as

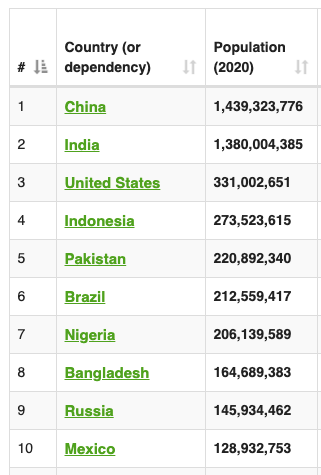
in 2020, the population of China was approximately ten times as many as Russia

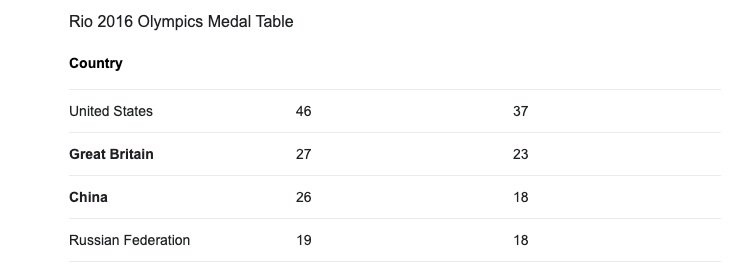
In Rio 2016 Olympics, The united states won 37 silver medals, more than twice as many as Rusian Federation

Cấu trúc more than và more..than trong bài task 1

Thầy Anh hướng dẫn các bạn cách viết so sánh sử dụng more than và more…. than

Cấu trúc more than

  • More than + number. Ví dụ: sales of computer accounted for more than 30% (ít hơn dùng less than nhé)

Cấu trúc more…than

  • Giữa More …than là mệnh đề. Ví dụ: More students enrolled in school A than school B
  • Giữa more…than là danh từ/ cụm danh từ. Ví dụ: Female students have more amount of time for study than Male students
  • Giữa more…than là tính từ hoặc trạng từ có 2 âm tiết trở lên, 1 âm tiết ta thêm -er vào sau nhé. Ví dụ horror film is more popular than sciencitific film hoặc popuplation of city A grows faster than that of city B